Impact Test
BS 131 – Notch bar tests
BS EN ISO 148-1 – Charpy impact tests on metallic materials
General
There are two main impact tests: The Charpy V-notch test and the Izod test. Both tests use a swinging pendulum which break accurately prepared notched test specimens; each specimen is broken with a single blow. Impact testing assesses notch toughness by measuring the energy absorbed by each test specimen during impact.
Naturally occurring notches, e.g. tool marks, undercut and lack of root penetration, reduce a component’s endurance, especially at low temperature. An impact test carried out on a weld determines the notch toughness of the weld at the test temperature.
Toughness is the ability of a material to withstand cracking or tearing.
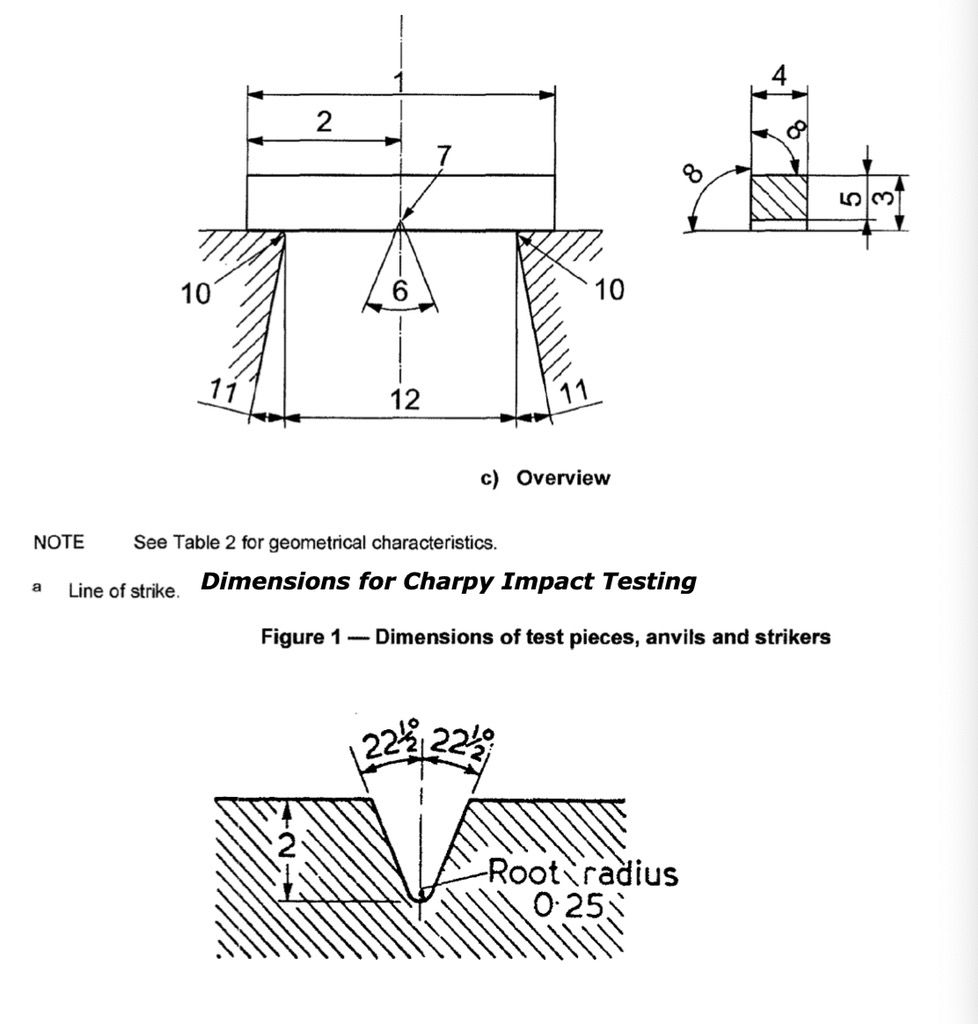
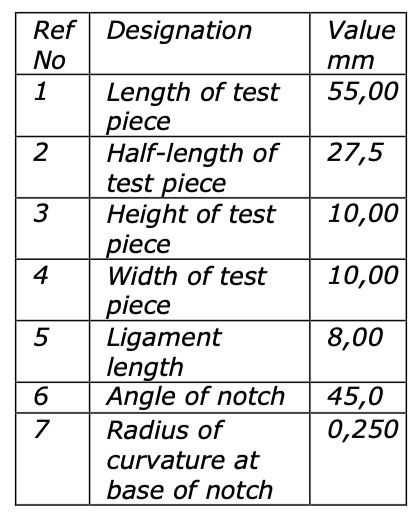
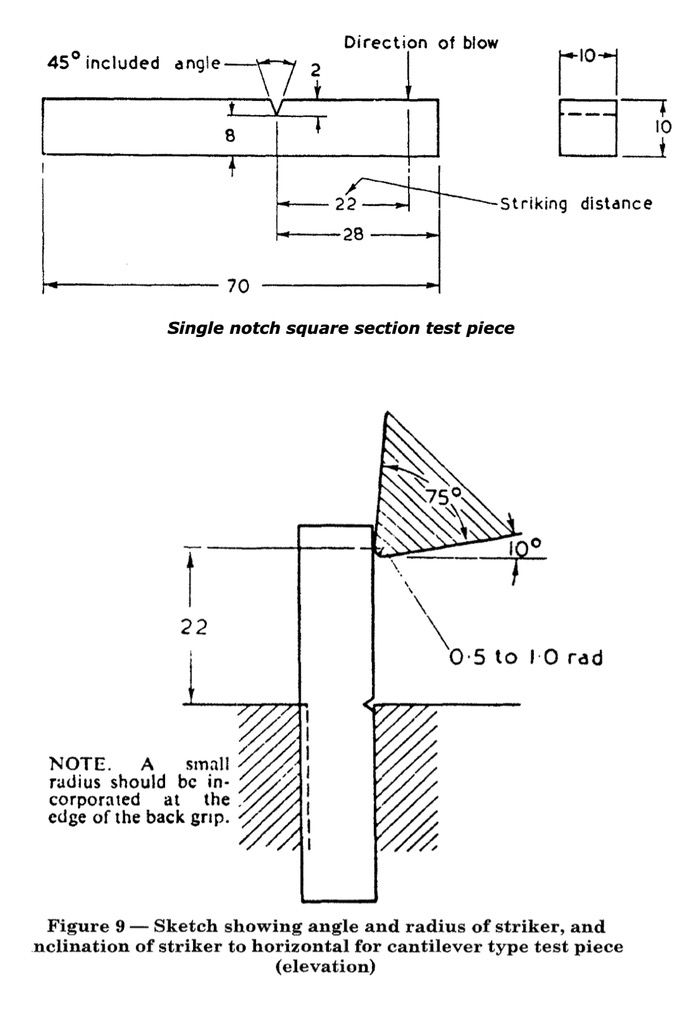
Test procedure
Test specimen dimensions and methods of support differ for the tests as shown below:
The notch can be measured using a shadowgraph
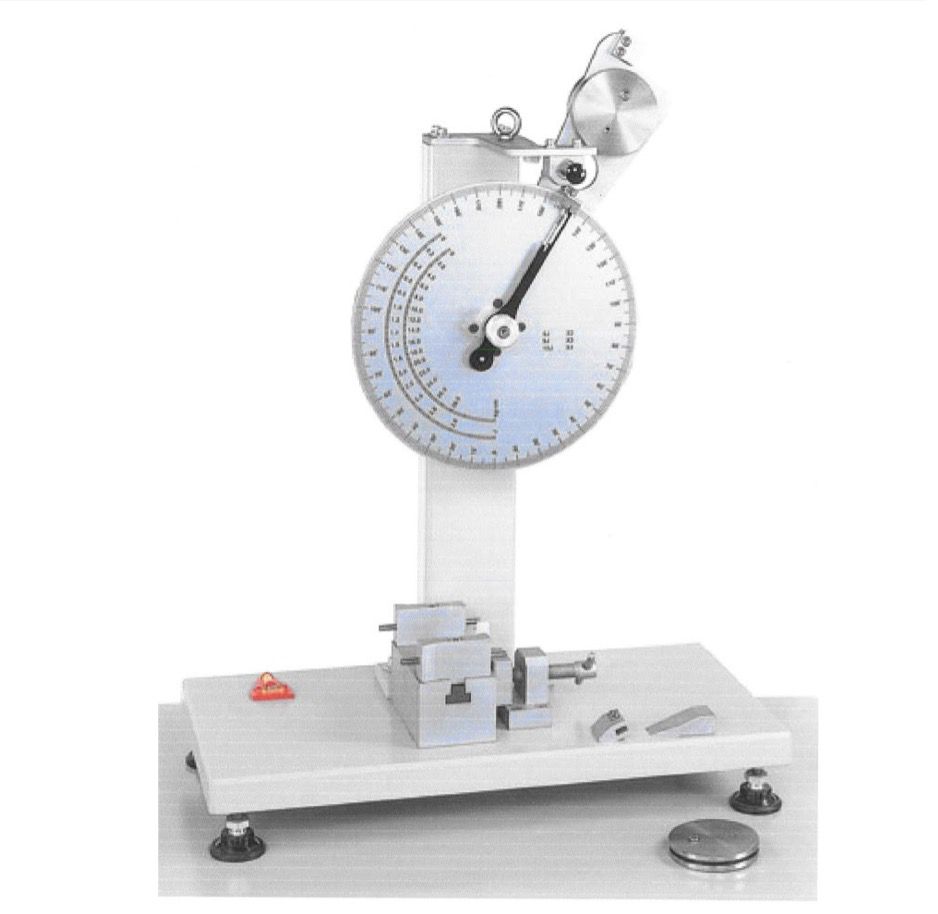
The specimen is positioned in the manner required for the test. The pendulum is then raised to a pre-determined height and released; the pendulum hits the specimen which immediately fractures in the notch area – the pendulum then continues its swing. During fracture, energy from the pendulum will be absorbed by the specimen, more energy being absorbed by tough specimens compared to brittle specimens.
The distance the pendulum swings after fracture – and consequently the absorbed energy – is measured by a pointer on a dial calibrated in Joules. The lower the value indicated, the more brittle the specimen, and conversely, the higher the reading the greater the toughness.
The Joule (J) is the System International (SI) unit for energy.
Impact test specimens are normally taken in groups of three to allow for scatter results. The notch position relative to the weld, the test temperature(s), and the values required will depend on the application specification.
Minimum energies specified for steels are likely to be within the range 10– 50 J; actual values may be much higher.
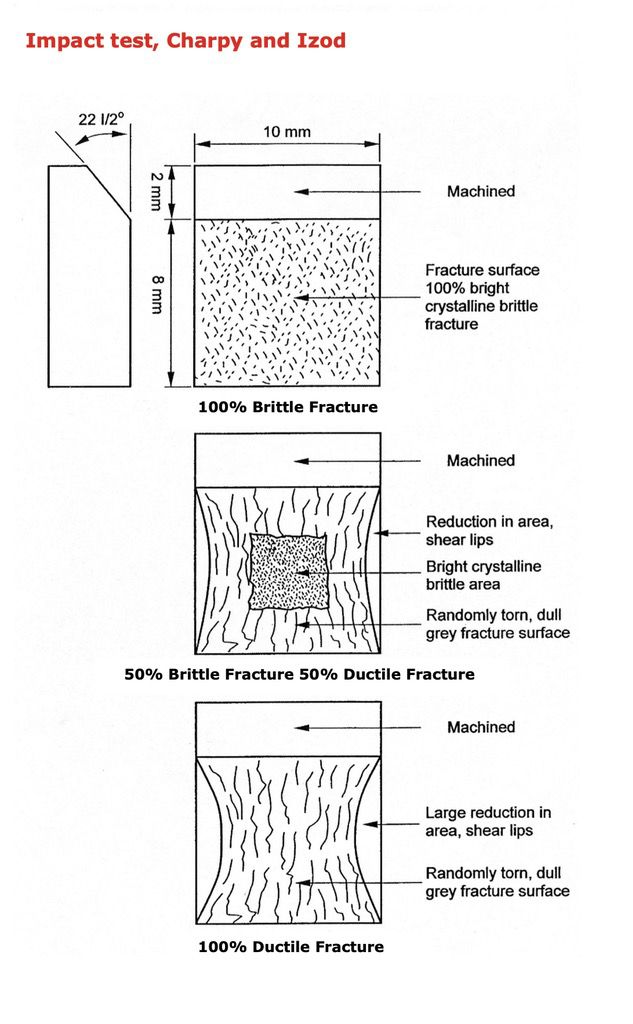
Impact testing can also be used to make up ductile/brittle transition curves. This is done by testing a number of samples over a range of temperatures, then assessing the grain structures of the fracture faces on broken specimens and plotting the percentage area of brittle fracture against the temperature of the test.